Interphase Corp. (INPH)
Here is the latest pick from Faizan's Stock Picks
"Interphase Corp. (INPH) is a technology company which specializes in computer peripherals. As of now it is trading at $5.20 a share. Interesting formations are appearing on INPH's chart which I would like to point out.
The following chart is a daily chart for INPH with an Ichimoku cloud overlay.

First thing to notice on this chart is that starting May 2009 INPH established a continuous downtrend which finally lasted in November 2010. During this 19 month time period the stock lost more than 80% of its value. At that time the stock was highly oversold, and was ready for a good upthrust.
Then, starting December 2010 the stock made some rapid upward moves and after about 1.5 years it finally broke above the Ichimoku cloud on incredibly high volume. Supporting this increase was a sharp uptrend in the stock's RSI which is a very bullish indicator. Also, at the tip of this uptrend the stock broke a very significant resistance level at $6.00 leaving no overhead resistance on this 3 year chart. This clearly shows that the current tape formation for this chart is very healthy and we can expect a continued upward trend for the near short term.
Now lets look at the another chart for INPH.
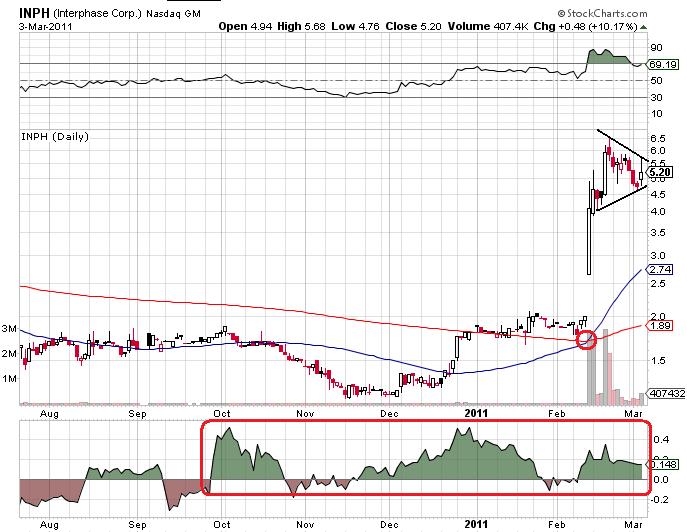
This is a one year daily chart without the Ichimoku overlay. On this chart we can see that after the recent high at around $6.50 the stock is now trading in a narrow symmetric range. A breakout above this range will indicate another bullish run, while a breakdown would mean a correction. So this chart is worth keeping an eye on as well.
Also, notice that recently the 50 day and the 200 day moving averages crossed over indicating a bull. Combined with that the Chaikin Money Flow indicator shows that the that the stock has remained above the crucial zero line for most of the last six months indicating that the stock is fueled up now and is ready for a ride. (For more on volume indicators read The Trader's Book of Volume: The Definitive Guide to Volume Trading).
Finally to decide on good sell points we shall take a look at the following all data chart for INPH.

It can be seen from this chart that the next resistance level(from 2007) is around $9.00-$10.00. So, this can be a good sell point for mid term traders. This is just a casual advice. Rely on your own intellect to choose a sell point, because finding a good sell point is more of an art than science.
(Being a pure technician I usually avoid listening to news about stocks. But going against my own beliefs I would like to throw in one: Interphase Corp's directors Strunk Christopher, and Myers Michael collectively purchased 9000 shares of INPH on 15th and 18th February.)
So to sum up I believe INPH is presenting an excellent buy opportunity, provided that the stock breaks above the narrow trading range (which may take a few weeks). That's all I have for now. Don't forget to subscribe for feeds. Have a great weekend!"
This Post was from Faizan's Stock Picks
Comment
-
Comment by J CHAN on May 3, 2011 at 3:07pm
-
PCS
-
-
PCS is making a move despite widespread weakness in the market.
-
-
Stopped out on BANR. Still like the stock. Set Buy Stop @ 2.71 and move stop down with the stock to see if it can be picked back up at lower level near breakout.
GENE reversed back up right above the stop at 7.30. Last look is at 9.10. Market maker love to still shares at the start of the day.
-
-
Like SEM and PACR also, but wait for further pull back before putting on Trailing Buy Stop.
-
-
Wednesday
Buy LINTA limit 17.8
Buy CSGP limit 68
Set Buy Stop TRS @23.65
Must set stop as soon as buy order is fill.
-
-
Move stop on GENE to 7.30. Getting greedy here.
-
-
Forget about the market. The strongest stocks ignores the market. You get stopped out before you know anyway.
-
-
Allow slightly more room on pullback. Stop at 1% below avergage of prior 2 days low.
Pick for today: NCR.
-
-
EEE may have find its bottom. INPH goes to look for its own. BOOM is going along too.
-
-
Correction - Not Coorection.
Join BullBear Traders
SUBSCRIBE Here
Pay with Cryptocurrency and SAVE!
(regularly $120.00)
Social Links
Steven Vincent's market analysis is published on:
© 2024 Created by Steven Vincent.
Powered by
![]()
You need to be a member of BullBear Trading: Stock and Financial Market Technical Analysis to add comments!
Join BullBear Trading: Stock and Financial Market Technical Analysis