Potential Long Term Topping Process Underway
(The following is an updated excerpt from the latest BullBear Market Report for BullBear Traders members):
Since the February high, market participants have been subjected to a stream of weak and worsening fundamental economic data. In the last week since the June 1st high, this trend appears to have accelerated. Investors have begun to question the viability of an ongoing bear market in the context of an increasingly questionable economic future.
Let's review the data over the last week (the following tables are courtesy of Briefing.com).
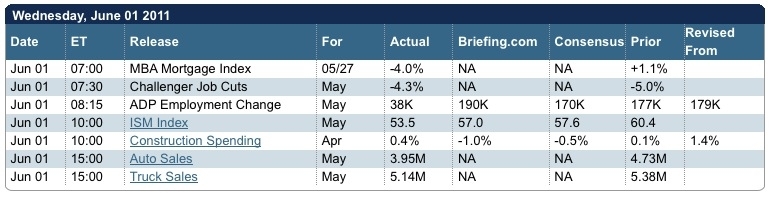
June 1 began the early morning with news that the Mortgage Bankers Association Index had plunged 5.1% from its previous reading. "Applications for refinancing dropped 5.7 percent and raised commentary from the Mortgage Bankers Association, which compiles the data, that many borrowers are unable to qualify because of low home equity. The association notes that the last time mortgage rates were this low, refinancing volume was more than 20 percent higher." (Econoday)
While the Challenger Job Cuts data was benign, the ADP Employment numbers were very disappointing. ADP estimated that private payrolls rose only 38,000 in May which was far below expectations for 210,000.
ISM Manufacturing Index came in far weaker than expected, though still a positive number showing growth in manufacturing sector. "Importantly, new orders slowed a very significant 10.7 points to 51.0, still over 50 to indicate growth compared to April but well under April to indicate a much slower rate of growth. Manufacturers drew heavily on backlog orders which fell 10.5 points to 50.5. Other readings show a significant slowing in production, a moderate slowing in hiring, and decreasing delays in delivery times that are consistent with slowing conditions. Inventories interestingly contracted in the month, suggesting that manufacturers were quick to keep levels down given slowing demand." (Econoday)
Construction Spending figures were a mixed bag and Auto and Truck Sales came in weaker than expected. Overall the data was sufficiently bearish to spark selling in stocks that retraced almost all of the gains from the prior 5 days of rally.
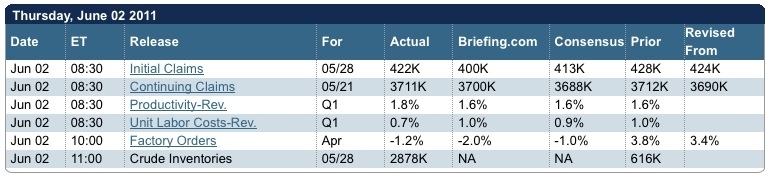
On June 2nd, Initial Jobless Claims came in essentially flat and had little market impact. Market participants and commentators began to reflect on the persistence of claims above the 400,000 threshold, however.
The chart begins to show a potential renewed upwards trend in claims:
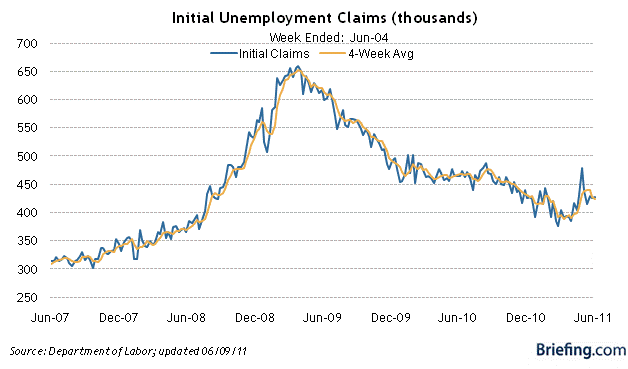
Factory Orders fell more than expected and this conformed to the weakness seen in the industrial production and ISM reports. Eventually the market succumbed to additional selling pressure as the data of the day only served to increase suspicions about the economic outlook.
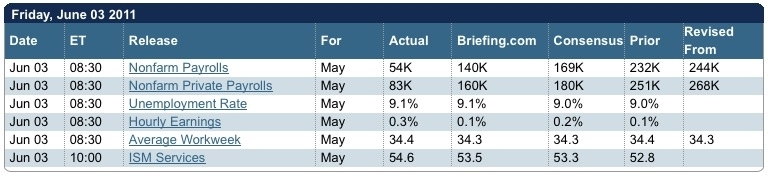
Friday, June 3rd saw some additional strong selling as the Unemployment rate rose to 9.1% and Non-Farm Payrolls increased by a only 54,000 jobs, well below the 169k expected. Markets ended at the lows of the day and of the week.
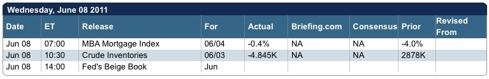
On Wednesday, the MBA Index fell again. Later in the morning, the Fed's Beige Book report indicated that economic growth was decelerating in all but one Fed district. This sparked an additional round of selling in the stock markets.
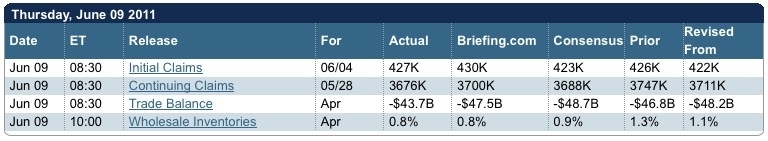
On Thursday the 9th, Initial Claims rose once again, continuing the disturbing pattern of higher claims above the 400k threshold. This time there was little market reaction as a rally which had begun overnight in Asia and Europe absorbed the blow. Stocks rallied to a breakout of the downtrend from the June 1 high.
Of course there are a variety of views about this data sequence and the market's reaction to it. At this time the consensus opinion appears to be that it represents an anomalous blip related to exogenous factors such as the Japan earthquake and nuclear crisis and the recent flooding in the south of the US. During periods when it's difficult to derive firm conclusions from fundamental data regarding the future of the economic environment, it helps to turn to technical analysis to see if that analytical tool set can shed any light on the situation.
In the introduction to my recent report, I detailed many of the non-technical elements that should have happened and could have happened and almost happened--but that ultimately failed to happen--leading to a non-confirmation of an ongoing bull market. Let's reiterate: I gave the bull the benefit of the doubt and argued its cause to the extent that it gave a cause to argue. But when reality departs from argument I will have to go with reality. Let's look at some technical factors which failed to confirm an ongoing bull market and give substantial cause to anticipate a renewed bearish environment.
First let's examine a long term chart of SPX:
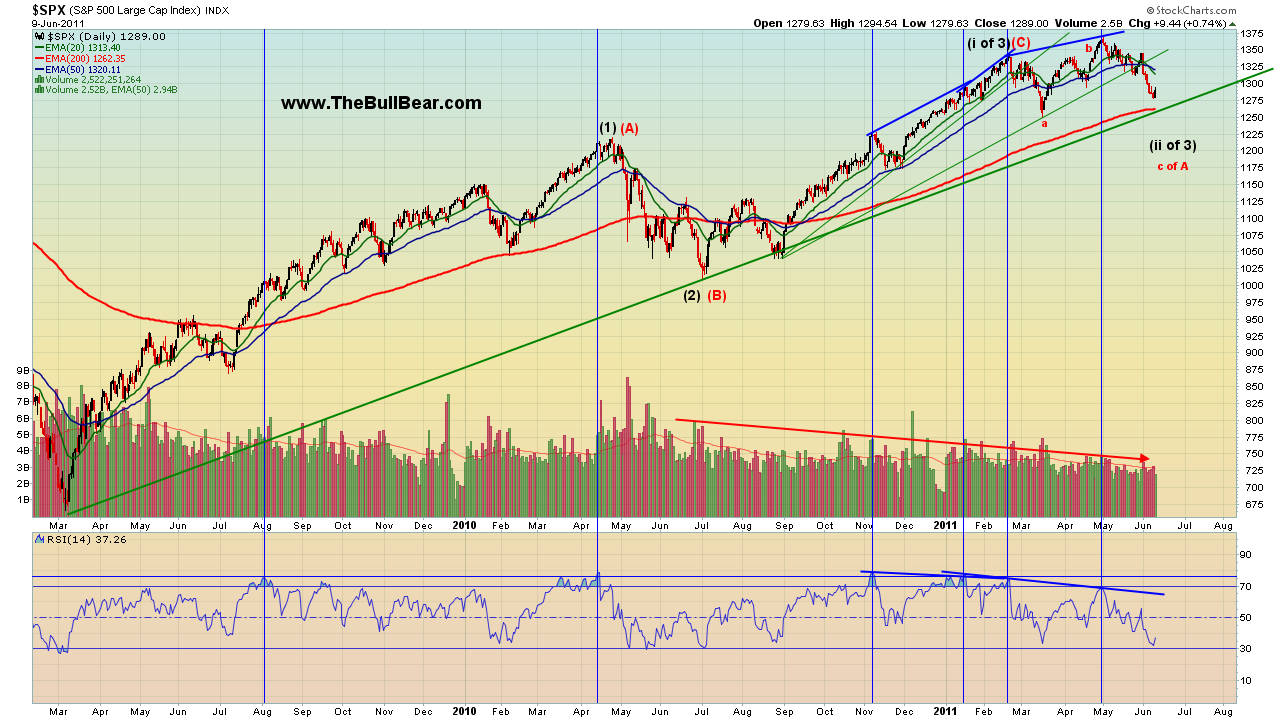
Since the August/September 2010 bottom, we have been operating under the thesis that SPX was probably in a bullish Wave 3 advance. If this is the case, there are some technical characteristics which should be present and some which should not be present. Separately, the persistently declining volume over the course of entire run and the successive RSI divergences are not necessarily troublesome, but together they add up to a technical non-confirmation and make the move much more likely to be a C wave. If the 50 MA of volume starts to turn up and volume levels persist above the 50 MA during an ongoing decline, that will probably be a long term bear signal. If RSI declines below 30 and breaks its March 2009 low, that would also be another confirmation of a bearish shift.
The 50 EMA of Advances-Declines is testing its key support zone from which intermediate term rallies have been initiated many times since March 2009:
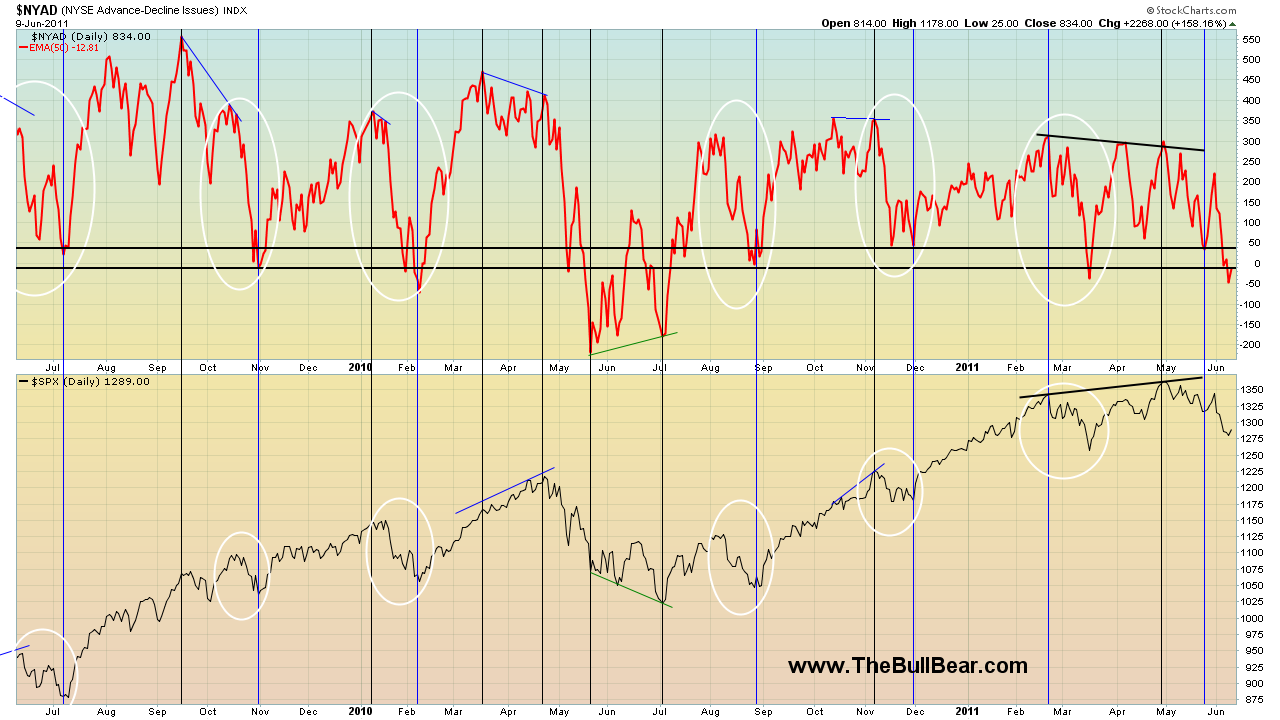
Of course, it's possible that it may rally sharply off this support zone again and the market may reverse. But there are some signs that that is not what is going to happen this time. First, note that the indicator has made lower highs as the market made higher highs--a bearish divergence. Second, note that the indicator recently bounced off of support but failed to attain a new high before heading back down again. Also note that the indicator is now nearly at its support level after a minor sell off in the market. This means that if the market breaks support this week the indicator is likely to also break through support and head back down to its May or July 2010 lows or below. This would likely represent a bearish range shift for this indicator and the markets.
Percent of Stocks Above 200 EMA has broken down badly:
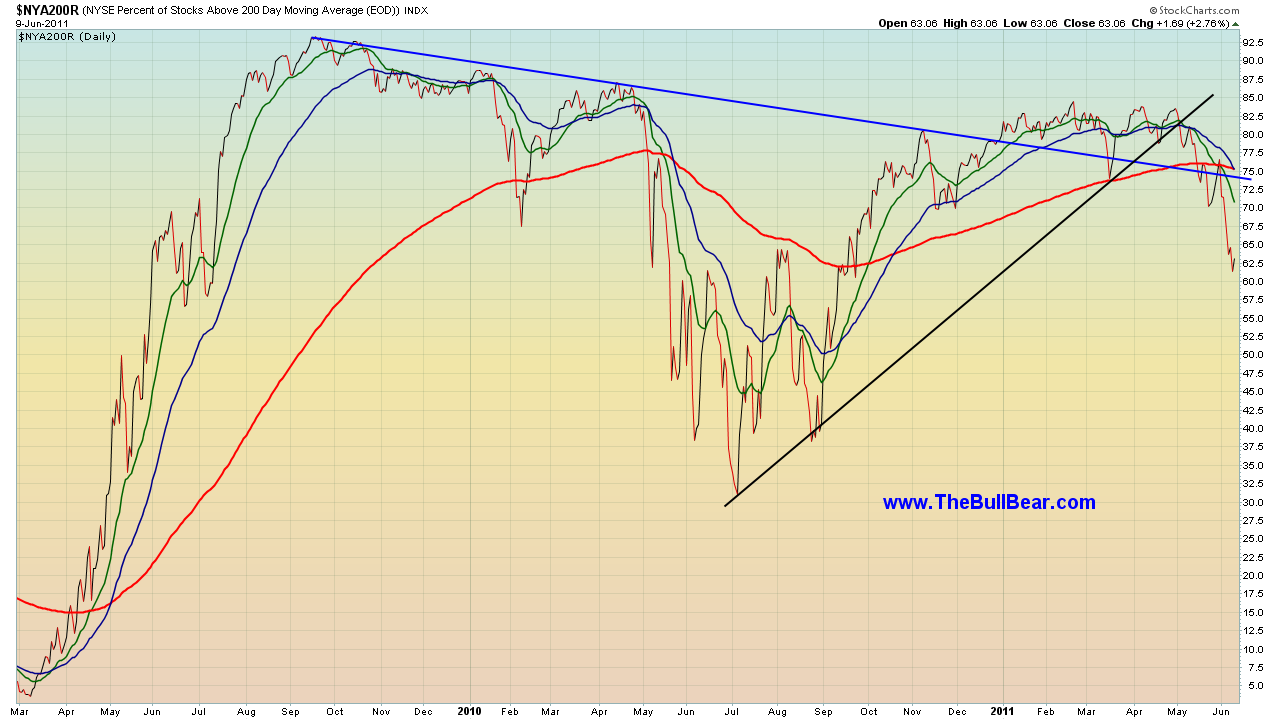
This is just one example of the many indicators that are leading the markets lower. The indicator has declined to readings well below the March and November lows while market price has not yet even taken out the March lows. Generally when technicals lead a market lower it is a good signal that market price will follow soon.
While the situation described thusfar could certainly reverse and propel markets higher, the important point to be grasped here is that on every count there have been significant attempts to move in a direction that would be bullish for stocks and general asset prices that have FAILED badly and REVERSED strongly in the opposite direction. What makes this even more inauspicious is the total failure of the trading and investing community to come to recognize and come to terms with the situation. Trapped in attachment to to established views they may be forced to reckon with reality all of a sudden, producing a steep, sudden decline in prices as everyone heads for the exit at the same time.
In the short term a minor rally is possible as there may be a bit of short term selling exhaustion and a bit too much bearishness creeping in to the markets. If the rally which apparently began today continues, the next minor high should be a good shorting opportunity for traders to ride the next wave down, which will likely be the strongest move seen yet this year. In fact I would say my current assessment of the markets is that the decline following this next corrective rally should be the strongest and most unidirectional drop seen since the April-July 2010 correction. After that I would expect rally which would retrace a decent percentage of the decline. Long term investors should be using any rally going forward as opportunities to take profits and raise cash.
To read the full BullBear Market Report, please join us at BullBear Traders room at TheBullBear.com.
Need some help staying on the right side of the markets? Join the BullBear Traders room at TheBullBear.com. You'll get this kind of timely, incisive, unbiased stock and financial market trading, timing, forecasting and investment technical analysis and commentary daily. It's free to join, no credit card is required and if you like my work you just make a donation at the end of each month.
Keeping You on the Right Side of the Markets
Comment
-
Comment by Ram Sharma on June 11, 2011 at 11:36am
-
In my view this correction should last between SPX 1225-1250 and next big rally should emerge led by tech-stocks going into early october.
-
Comment by Steven Vincent on June 9, 2011 at 2:43pm
-
For answers to many of these questions please join us in the BullBear Traders room and look at the updates to my latest analysis: http://www.thebullbear.com/forum/topics/060111-bullbear-market-report
-
Comment by leo ferrari on June 9, 2011 at 4:37am
-
-
Hi Steven
The market seems to be looking for a bottom, the futures are up across the board this morning - Will it be tradable ? What is your take?
Thanks,
Stef.
-
-
Very informative, I will follow with interest.
Kind regards.
-
-
i wish to share an observation. the stock market was hit hard this last six sessions WHILE the dollar was falling.It will be interesting to see what happens if the dollar reverses.
A question,if we get a big sell off in stocks,where will the money go?
cash?
bonds?
-
-
I appreciate very much analysis. It will be interesting to see what lies upon.
-
-
Hello Steven,
Thanks for the update;
Waiting to see what the market may have in store ...
With you & your uncanny vision on our side, we may well make it safely over this summer.
Sincerely,
Stef.
Join BullBear Traders
SUBSCRIBE Here
Pay with Cryptocurrency and SAVE!
(regularly $120.00)
Social Links
Steven Vincent's market analysis is published on:
© 2024 Created by Steven Vincent.
Powered by
![]()
You need to be a member of BullBear Trading: Stock and Financial Market Technical Analysis to add comments!
Join BullBear Trading: Stock and Financial Market Technical Analysis