Correction or Continuation? The Market Will Answer Very Soon

Monday, March 29, 2010
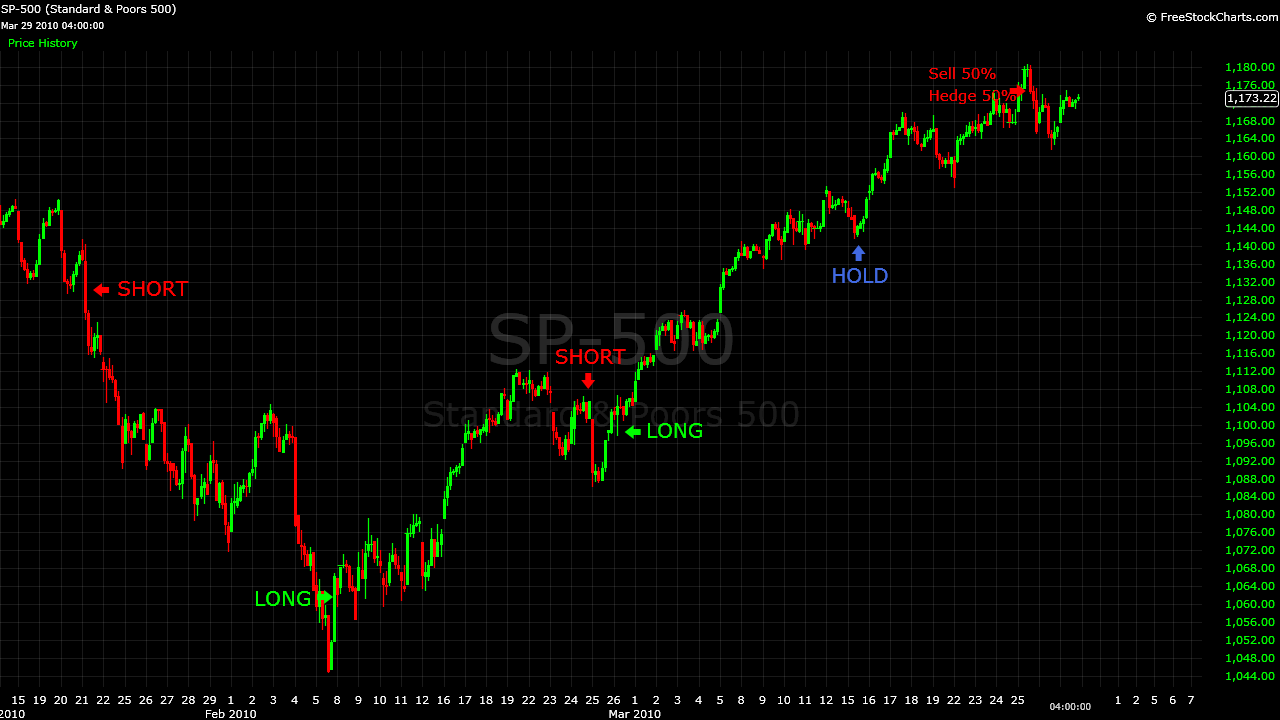
BullBear traders have been long US equities (with the exception of a brief 2 day interlude) since the February 5th bottom. We took half of our profits in anticipation of a minor wave 4 correction but we continue to hold 50% of our long positions with an eye towards a mid-late April wave 5 of 5 top to the major Wave 1.
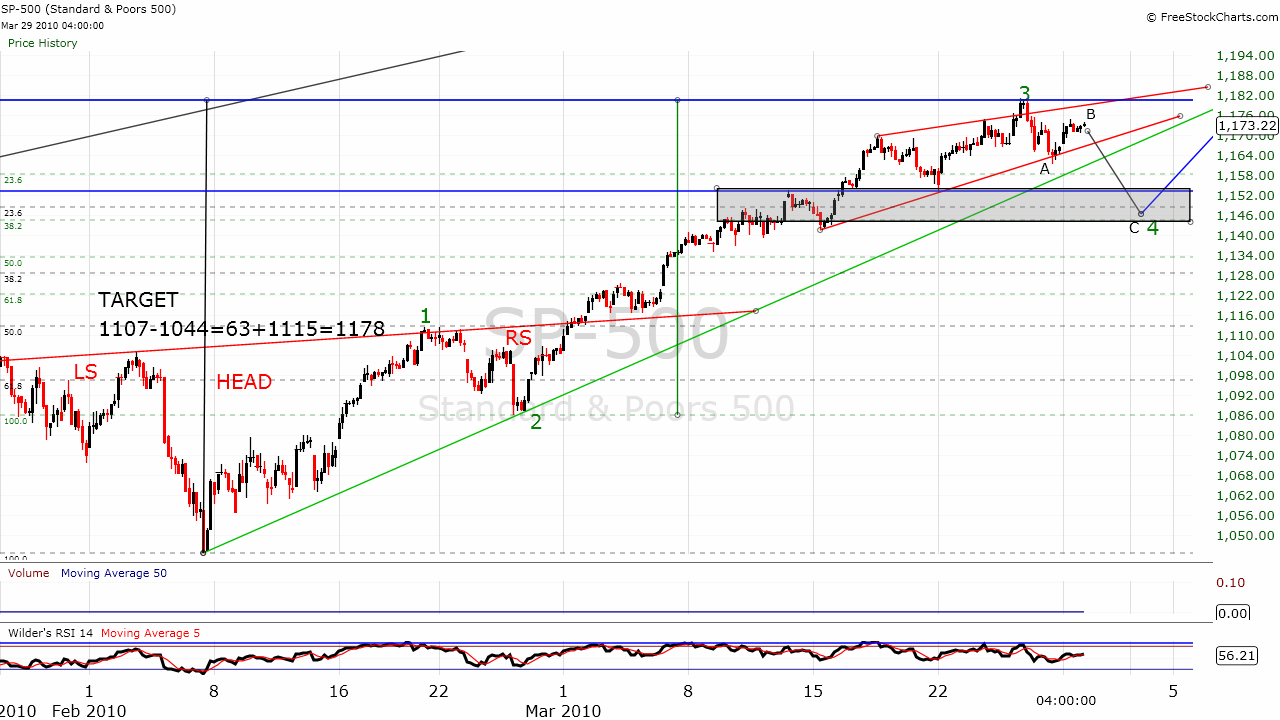
The SPX has fulfilled its February reverse head and shoulders bottom target and should have commenced a wave 4 correction. The type of correction seems to be in doubt and there remains the possibility that wave 3 has not yet completed and will extend to a double top at 1180 or even to whole number resistance in the 1200-1205 area.
The above 3 wave zig zag correction would be the most convenient and expeditious for the completion of the wave 4 correction--but since when did the market ever make things easy for traders? Here's a closer look at two views of possible corrective wave structures: a zigzag and a flat.
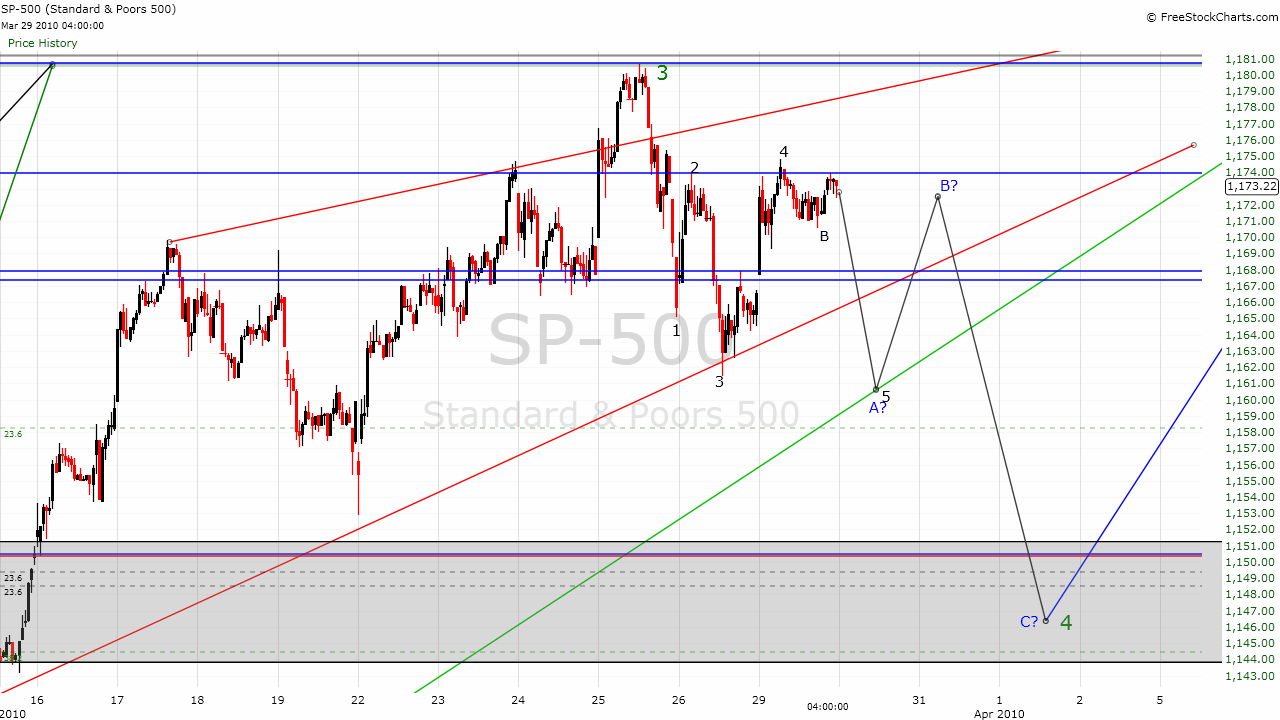
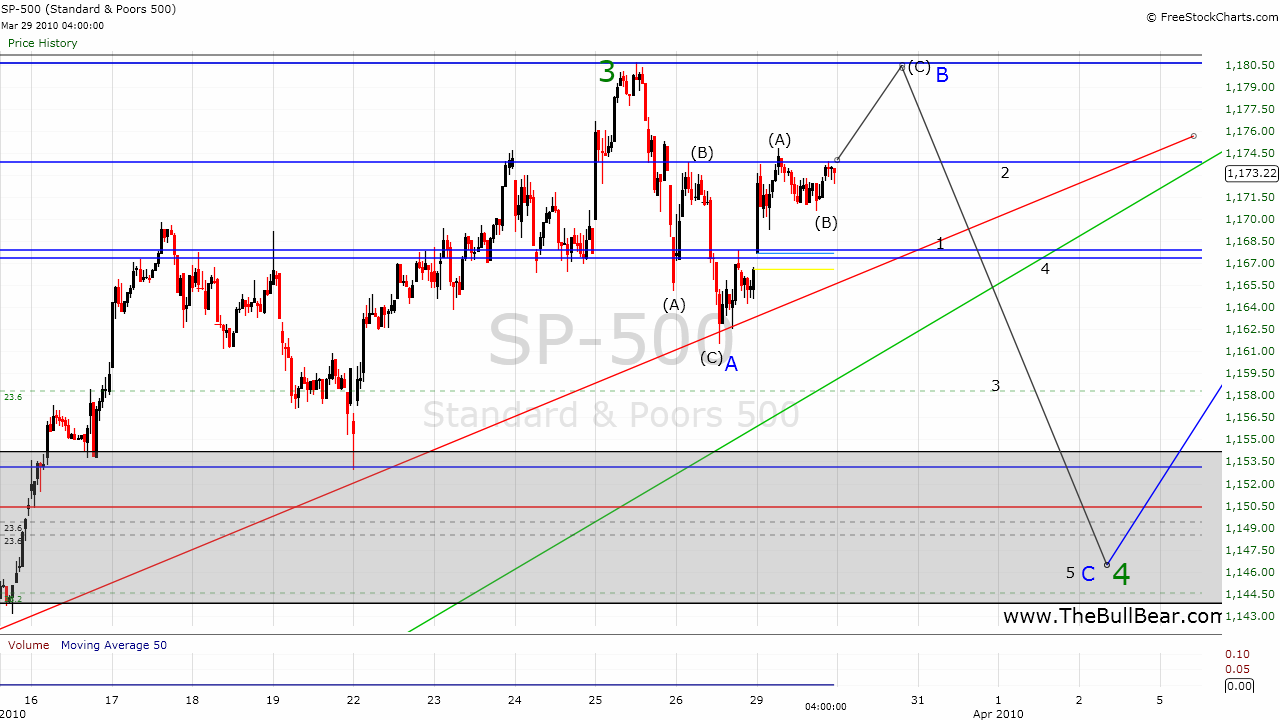
We should have a clearer picture after Tuesday's action. The 1174 area is key. A move that closes an hourly bar above 1174 is likley to produce the flat, double top correction and a weak open and selloff will likely manifest the zigzag pattern. It is also possible that wave 3 will extend to the next level of resisitance in the 1200-1204 area, however, breadth and sentiment indicators are (or at least were as of the weekend) sufficiently overbought to warrant the wave 4 corrective action. In any case, BullBear traders have been warned to not short this action since it is too choppy, shallow and brief to trade successfully (except as a daytrade). We want to be in the best possible position to buy back our shares for the final wave 5 of 5 advance to 1228-1244. That should mean 100 points of profit on the SPX from a 1144 bottom. The 1228 is exactly the 61.8 Fibonacci retracement level of the bear move from the all time high in 2007 as well as the 23.6 Fibonacci retracement level of the bull market from the 1982 bottom. There is also horizontal price congestion from 1999, 2001, 2005, 2006 and 2008 at that level. The 1244 level is the target given by the reverse head and shoulders bottom that began formation in November of 2008. By that time and price full bear capitulation will have taken place and breadth and sentiment indicators should be quite overbought on all time frames, setting up the most significant decline in time and price yet seen since the bottom in March of 2009. Based on the wave structure and available supporting evidence at this time, such a decline will likely be a corrective A-B-C Wave 2 rather than a resumption of the prior bear trend.
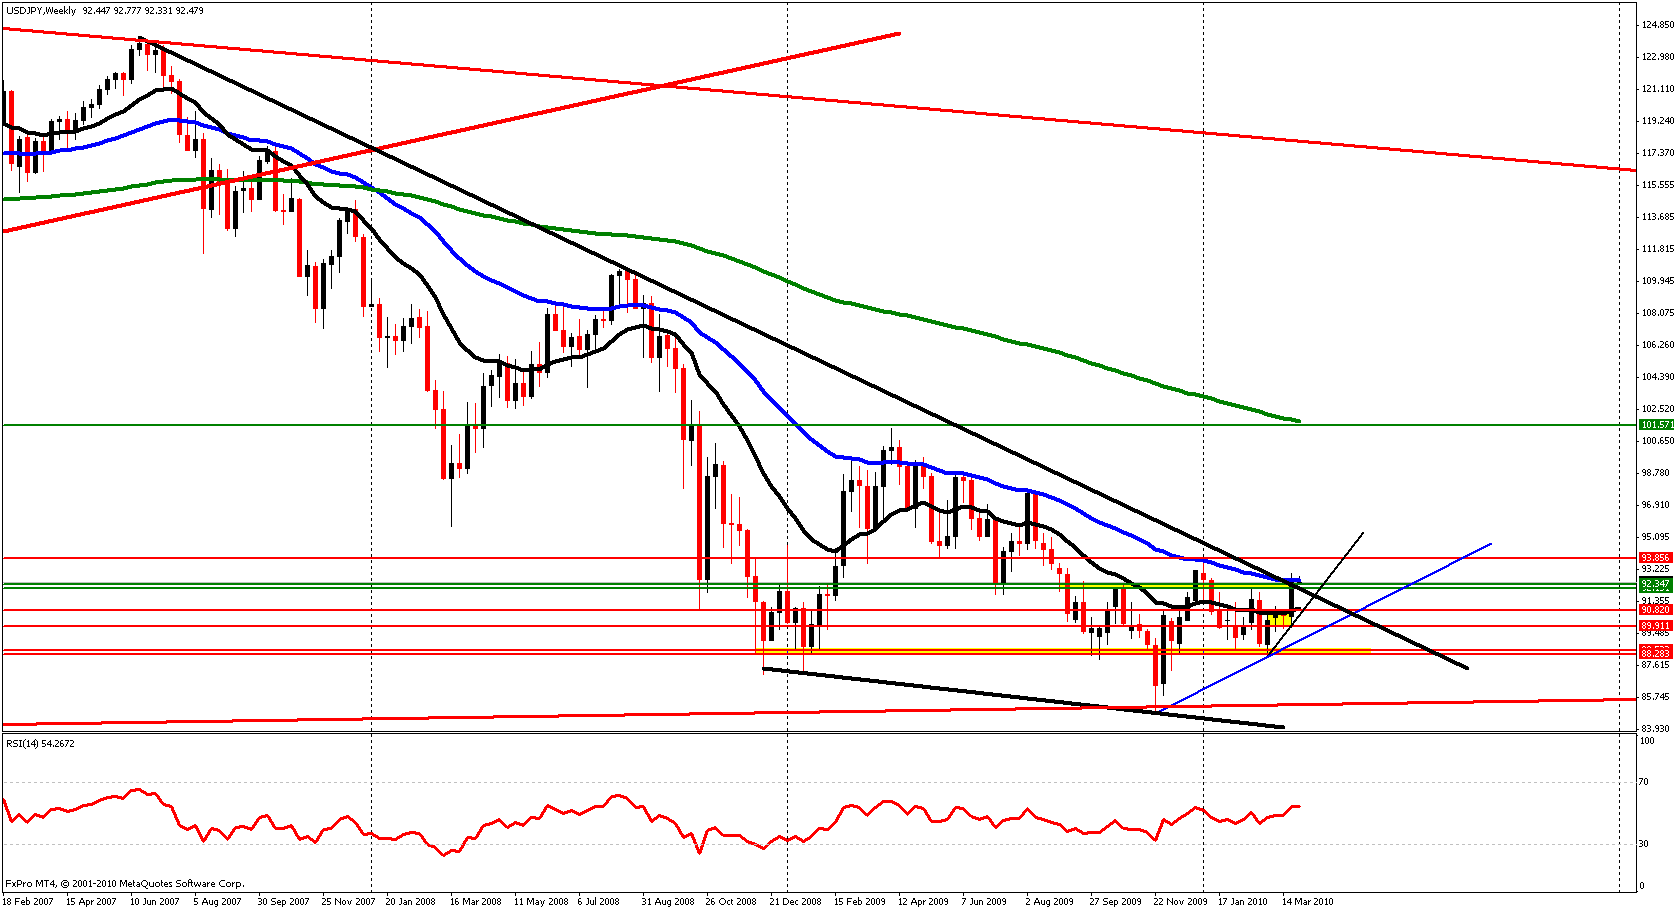
In the last BullBear Weekend Report, I called for a big upside breakout in USD.JPY. We sure got one. This is the beginning of a major trend change after a multi-decade bottoming process. Yen weakness may also signal that the Yen carry trade is back on and another liquidity pipeline may be back in service. This can only further fuel the newly emerging asset price bubble.
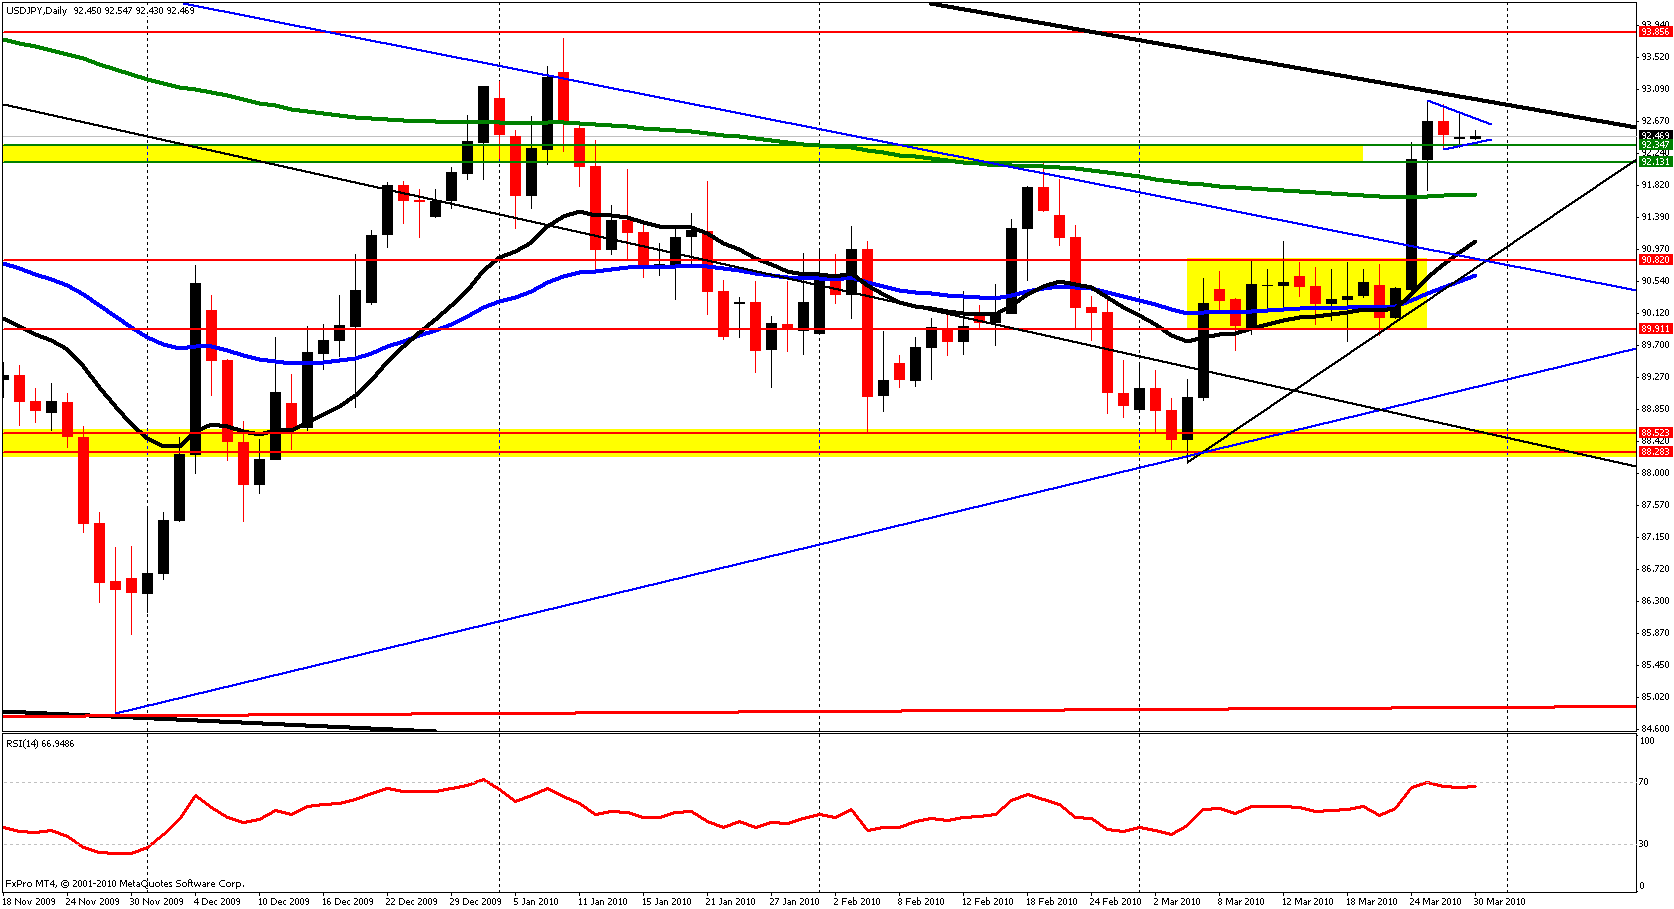
The Weekly chart shows that major long term trendline resistance and the 50 week EMA are close to being taken out. These are major technical events.
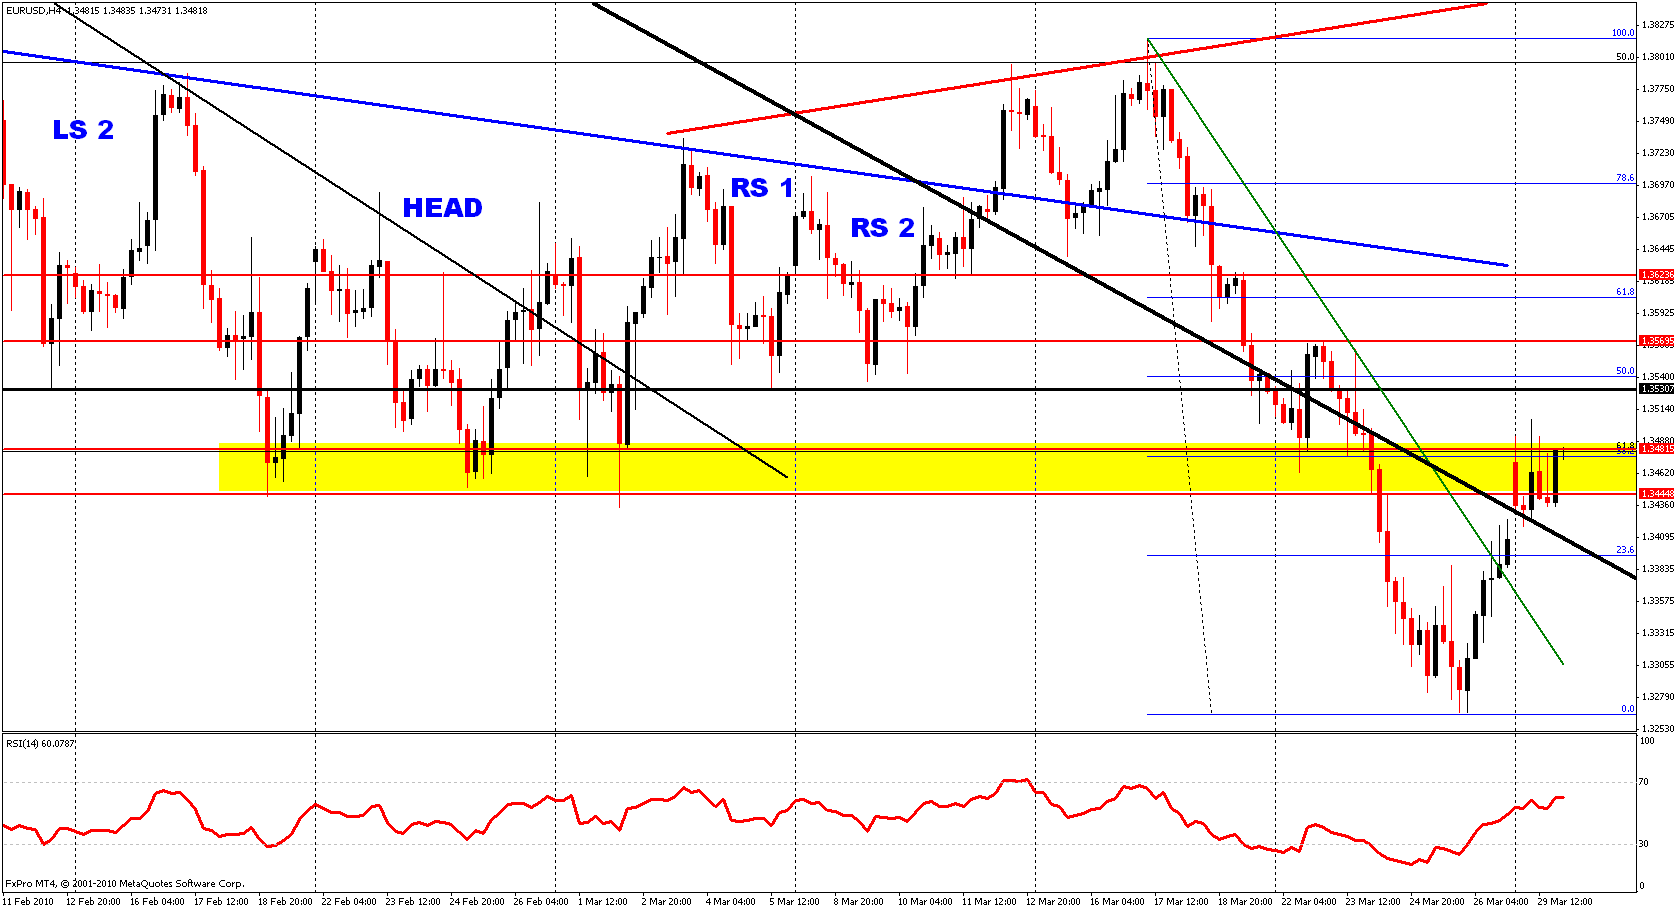
After a major bottoming pattern failure and a failed breakout of the major downtrend, the Euro has rallied straight up to technical resisitance. That the rally has not been immediately rejected may be bullish. On the other hand, the pattern failure is a major technical event and its bearish implications will not be easily overcome.
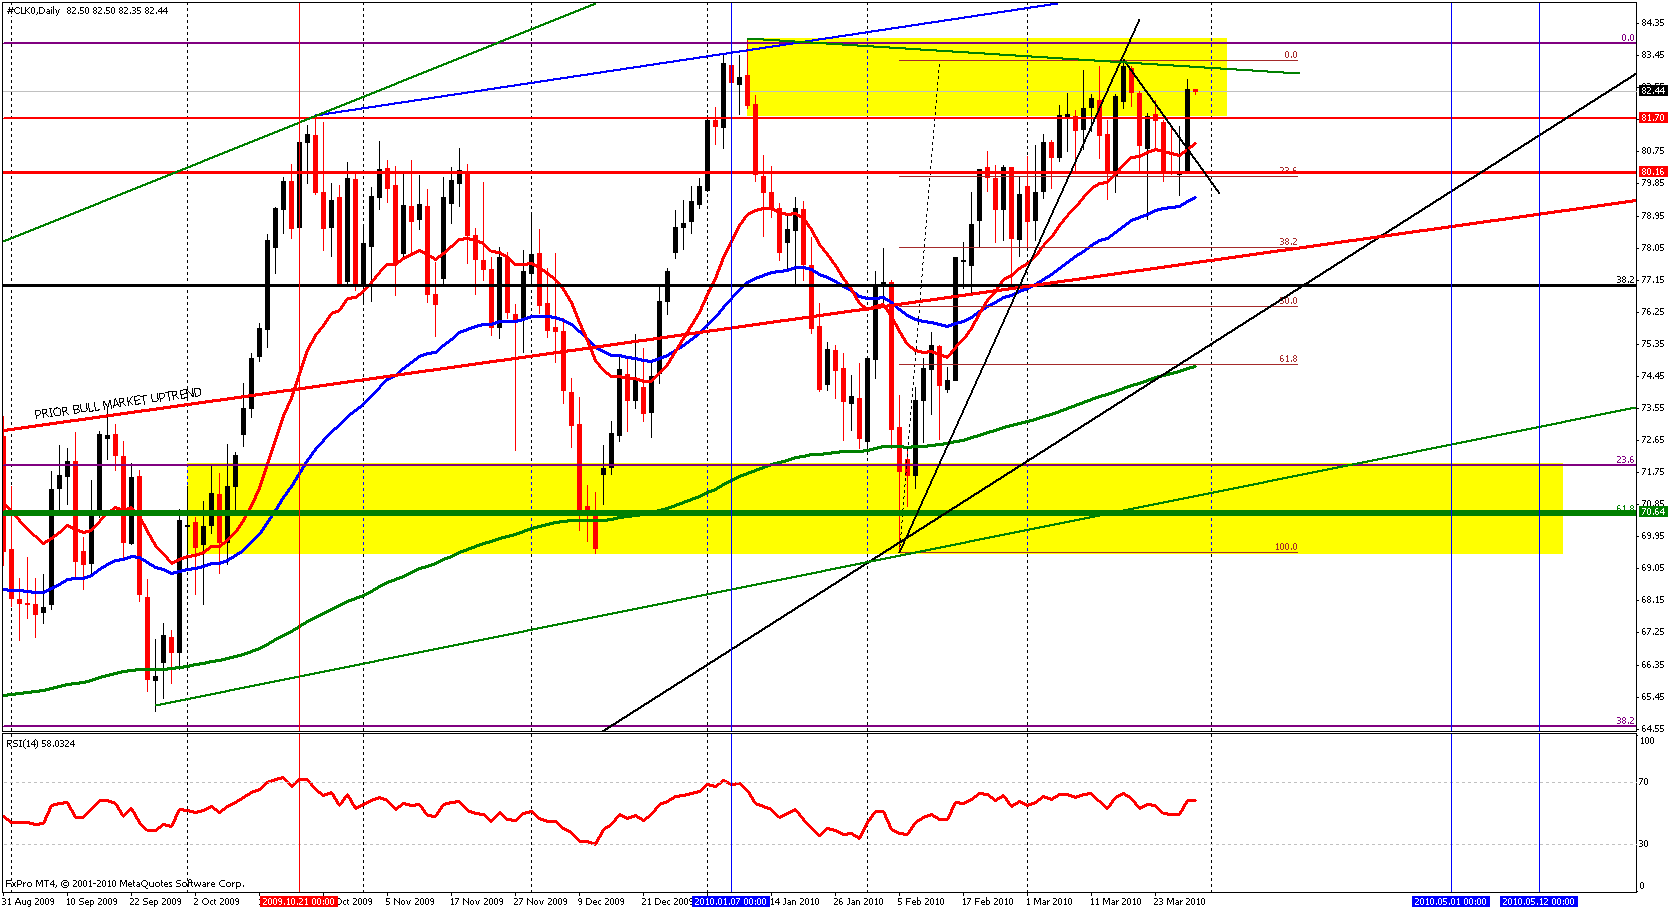
BullBear traders were warned of an impending breakout in crude oil as well, though I was not quite sure of the direction of the breakout. Today the market asserted itself to the upside and the move, unlike many preceding it, held. The 20 and 50 EMA's are now rising together in bullish alignment. Let's look for a long entry on any retracement to the $81.70 area. Stop loss is a close below the 50 EMA. A weekly close below $81.70 would raise a caution flag on this market a set up a possible short sale opportunity.
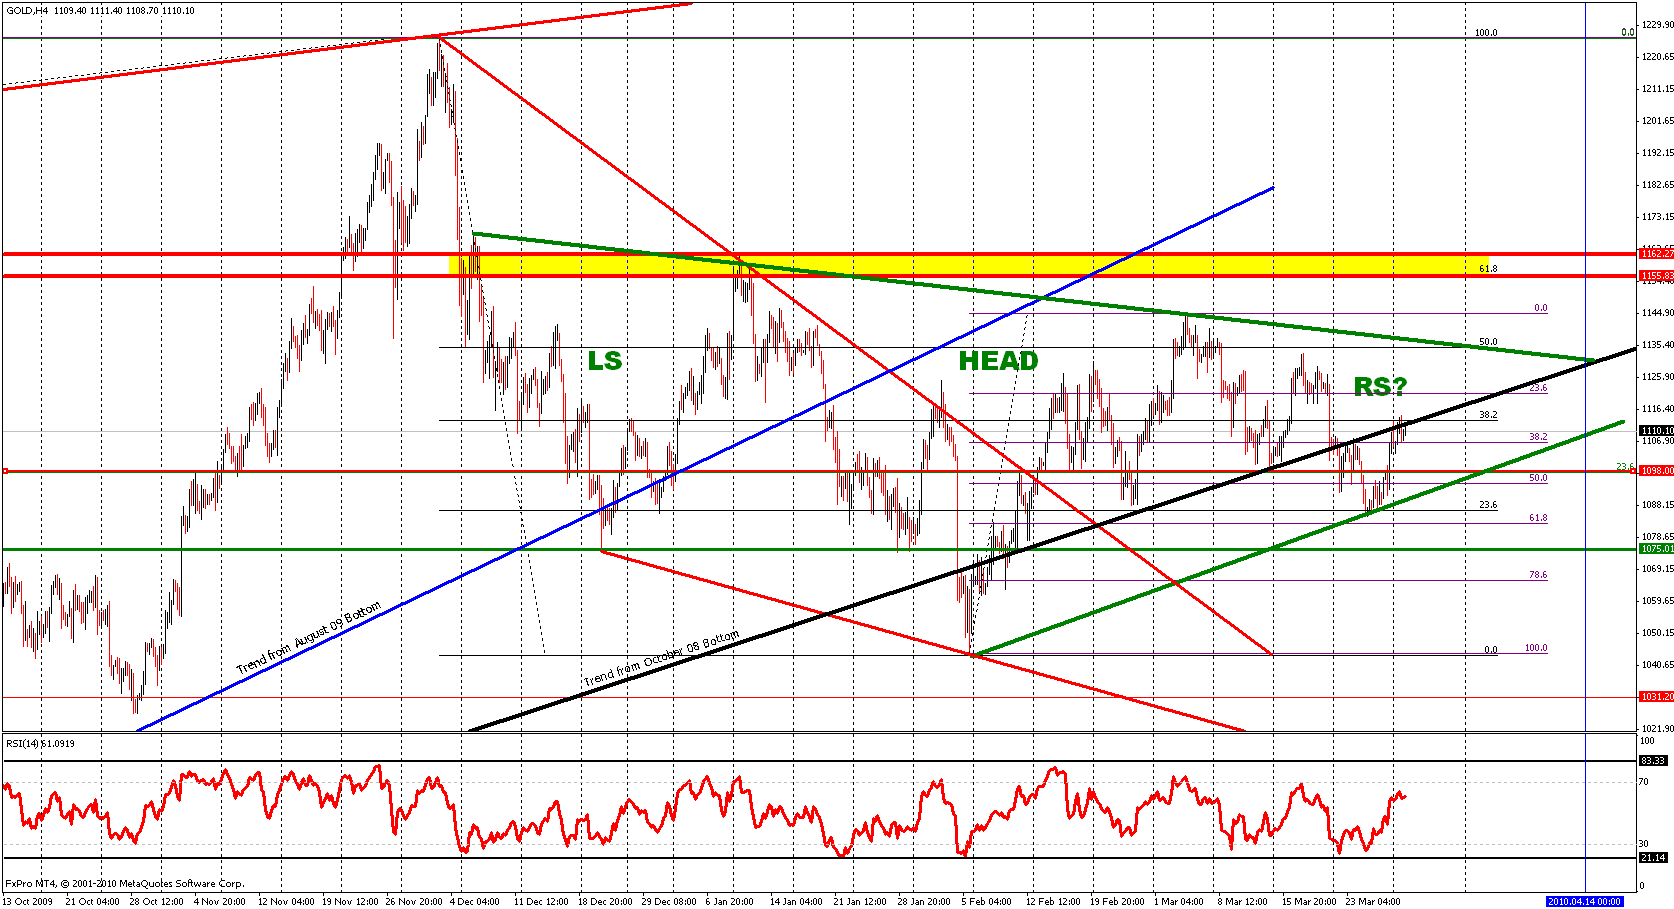
Gold carving out another reverse head and shoulders bottoming process. I suspect that we will see further weakness to the 1098 area where gold would then put in the peak of the right shoulder and become a strong buy. That's also the 23.6% Fibonacci level of the move off the October '08 bottom. On the other hand, price is now into its second week trading below the trendline from the October '08 bottom. A weekly close below 1075 would put a bearish tilt on this market.
For a more complete analysis including coverage of stock sectors, the precious metals, crude oil, forex and technical indicators watch the most recent BullBear Weekend Report:
Generally these reports as well as twice weekly video reports are prepared for BullBear Trading Service members and then released to the general public on a time delayed basis. To get immediate access just become a member. It's easy and currently free of charge.
Good luck and good trading!
Steven Vincent
TheBullBear.com
"Keeping You on the Right Side of the Markets"
Disclosure: Long USD.JPY, Long SPX
Good luck and good trading!
Steven Vincent
TheBullBear.com
"Keeping You on the Right Side of the Markets"
Disclosure: Long USD.JPY, Long SPX
Replies to This Discussion
-
Permalink Reply by Steven Vincent on
-
BullBear Trading Service members received this alert overnight:
Overnight action in all markets--equities, commodities, forex--strongly suggests that the Wave 3 upleg is in fact not over. An initial target for the completion of this leg should be SPX 1204. 1180 may act as some resistance but I believe it will be overcome easily. The breakout in the Yen and an apparent reversal in the US Dollar coupled with a surge in commodity prices and a breakout in crude oil suggest a hyperliquid, high risk appetite environment in which sideline money is charging in while bears and shorts scramble to cover. This is a recipe for a fast, quick move to new highs. I think any thoughts of a meaningful correction should be set aside for the moment.
-
-
Whoops! And another intraday reversal suggests that we may yet be in corrective mode. The choppiness of the action is typical of a wave 4 flat correction. There should be a lower low however in wave c, which may have begun today.
Join BullBear Traders
SUBSCRIBE Here
Pay with Cryptocurrency and SAVE!
(regularly $120.00)
Social Links
Steven Vincent's market analysis is published on:
© 2024 Created by Steven Vincent.
Powered by
![]()