BullBear Market Report UPDATE

Tuesday, March 23, 2010
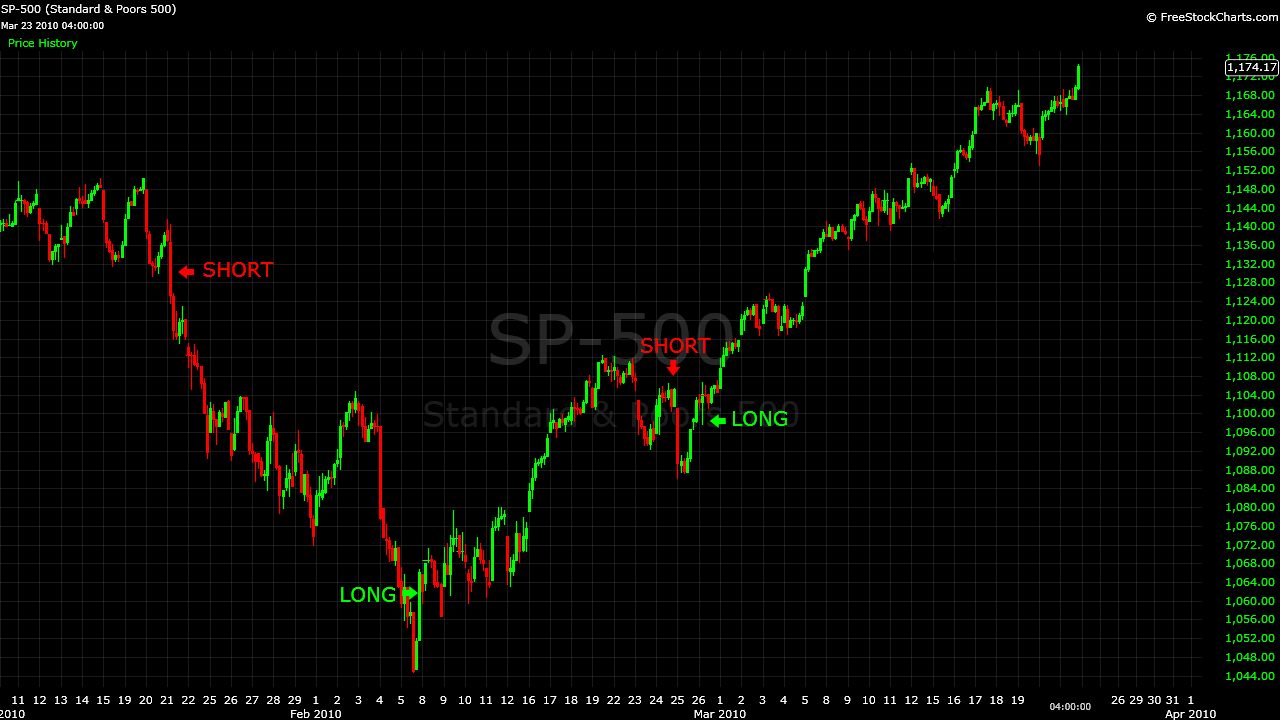
BullBear traders have been long US equities (with the exception of a brief 2 day interlude) since the February 5th bottom. We continue to hold our long positions with an eye towards a mid-April top.
The SPX appears to be about half way through completing Wave 5 of the first wave of a bull market.
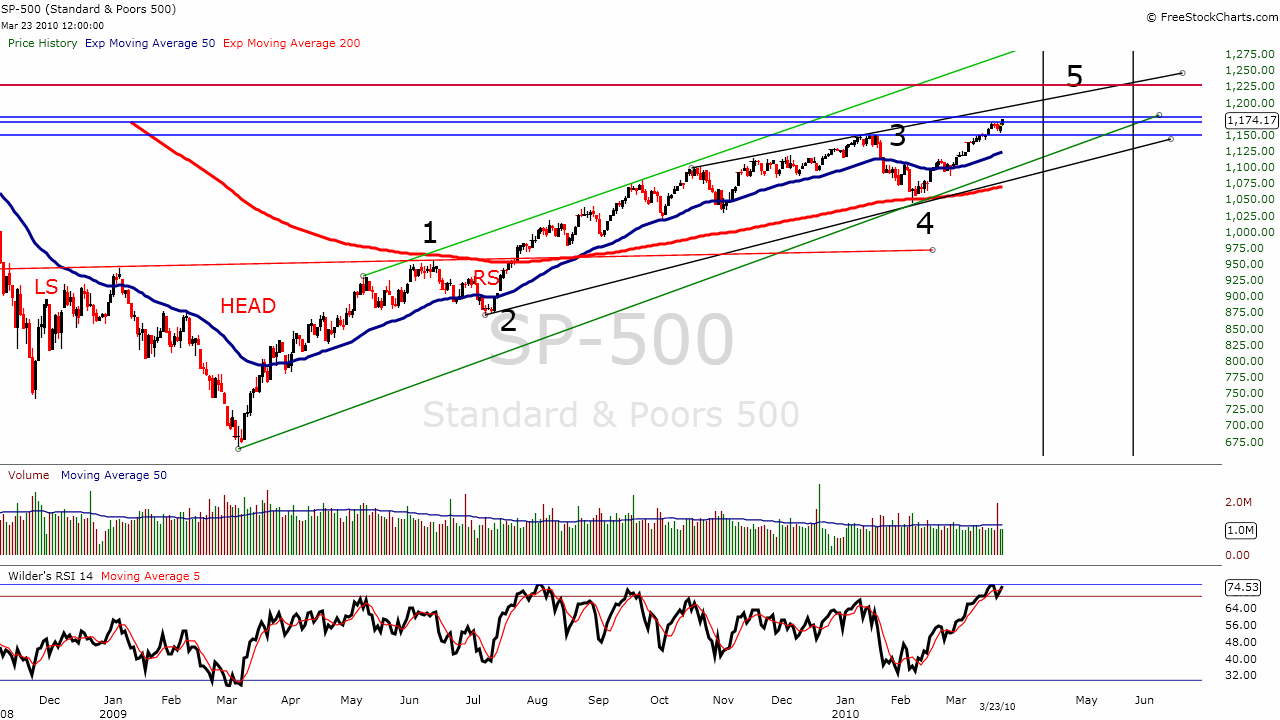
Wave 5 appears to be nearing the completion of its wave 3. The ensuing wave 4 A-B-C correction seems likely to set up the final wave 5 of 5 to a mid-April top in the 1228-1244 zone. The 1228 is exactly the 61.8 Fibonacci retracement level of the bear move from the all time high in 2007 as well as the 23.6 Fibonacci retracement level of the bull market from the 1982 bottom. There is also horizontal price congestion from 1999, 2001, 2005, 2006 and 2008 at that level. The 1244 level is the target given by the reverse head and shoulders bottom that began formation in November of 2008. By that time and price full bear capitulation will have taken place and breadth and sentiment indicators should be quite overbought on all time frames, setting up the most significant decline in time and price yet seen since the bottom in March of 2009. Based on the wave structure and available supporting evidence at this time, such a decline will likely be a corrective A-B-C Wave 2 rather than a resumption of the prior bear trend.
Should SPX finish the month above current levels, it will have successfully closed above two key long term moving averages--the 50 month EMA and the 160 month SMA--which were previously key support during the prior bull trend.
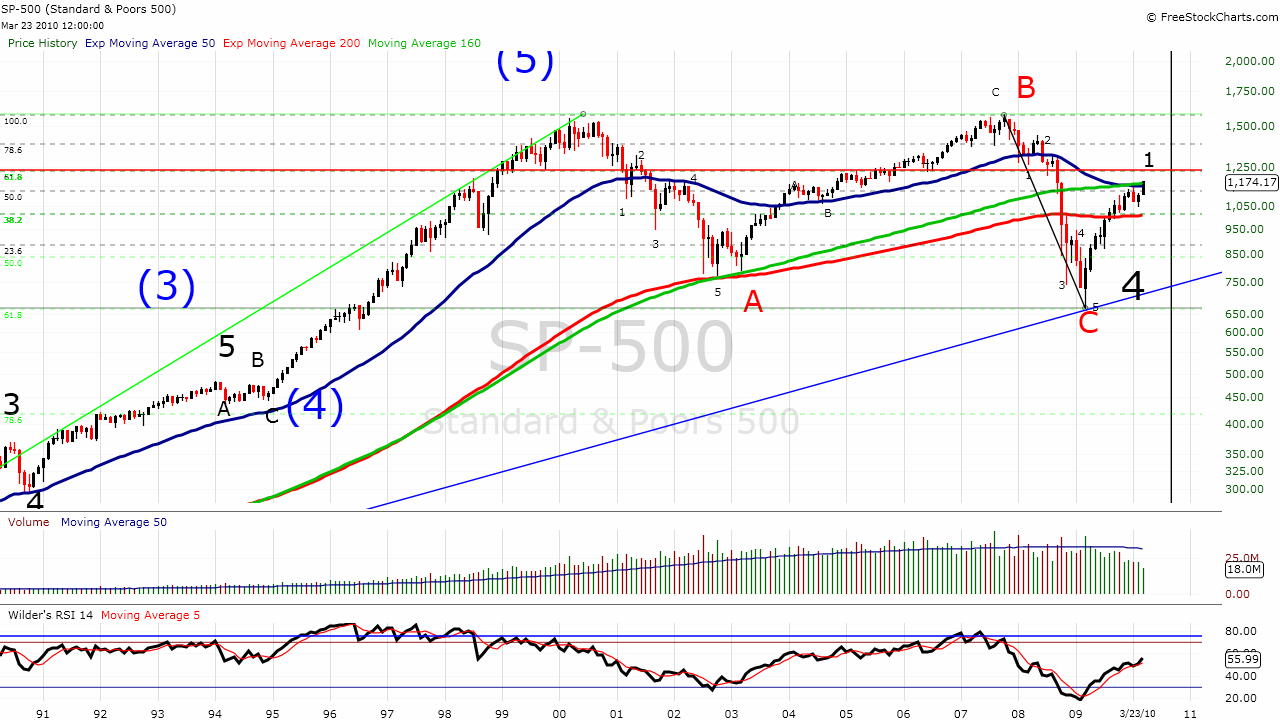
On a very long term basis, an argument can now be made that SPX is now in Wave 1 of Wave 5 in the primary bull market that began after the better than 90% retracement that ended in 1932. In this schema the lateral bear market from 2000-2009 was a Wave 4 A-B-C corrective wave similar to the lateral corrective Wave 2 from 1966-1974. The bull market that ended in 1929 marked the end of the Industrial Revolution wave in financial assets. We are then currently beginning the terminus wave of the Financialist Fiat regime that began with the founding of the Federal Reserve system in 1913 and the subsequent adoption of Keynsian economics and socialist government. This wave may possibly be marked by a pure asset bubble without any fundamental underpinnings whatsoever and may be very large as well as short in time but followed by a resoultion similar to the post-1929 scenario. The dénouement of this epochal terminus would then resolve into the age of World Government and Global Economic Management. This is a working thesis and there are other interpretations of wave counts as well as socio-economic development.
With regards to much more near term developments, much ado has been made about the sentiment picture, particularly with regards to put/call data. Let's have an in depth look at the Equity, Index and Total put/call ratio data. Here we are working with a 21 day SMA with a line price on close.
The Equity put/call data is generally regarded as a measure of sentiment of the "dumb money"--speculators who are generally wrong on the market. When they are buying calls heavily in a bull trend it is a contrarian signal that a top is near and vice versa.
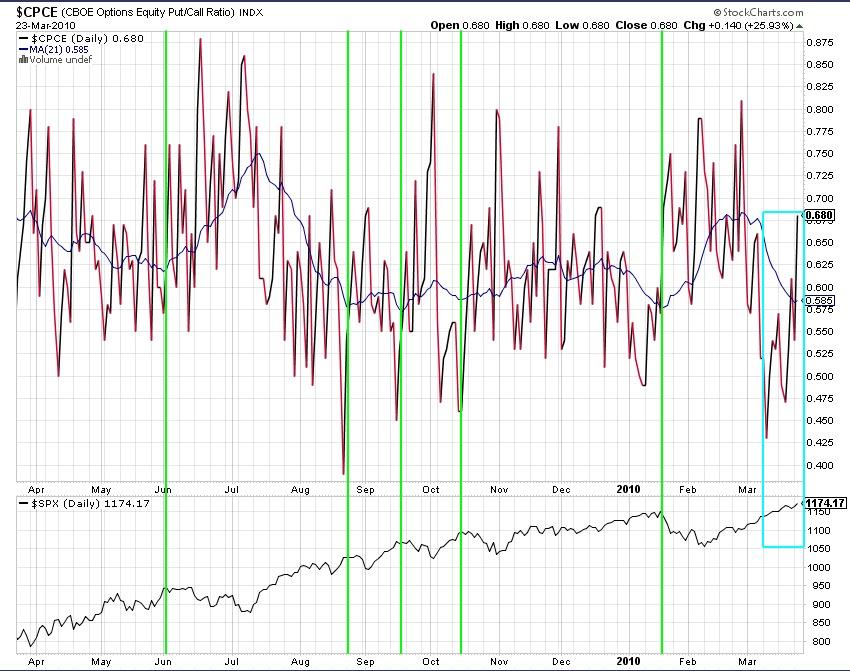
First, let's take this rally off the February bottom as an analog for the rally from the July bottom. Both followed A-B-C corrective waves which were similar in size and time. We can note that the moving average has declined to a level close to its reading at the August top after the July bottom. Yet the decline following that reading was short and shallow and failed to produce the fear that would drive equity options players to purchase puts. Thus, the rally continued while the readings bumped along the bottom. Today we can see (blue box) that since March 8th equity players have been buying puts into the rally in a series of rising price lows peaking at very high levels on a bullish breakout day today. This is hardly a picture of the complacency associated with significant tops in sentiment and price. There seems to be a drive to pick a top here rather than throw into the rally.
The Index put/call data is generally regarded as an indicator the "Smart(er) Money"--professional portfolio and money managers who typically use index puts to hedge their long exposure.
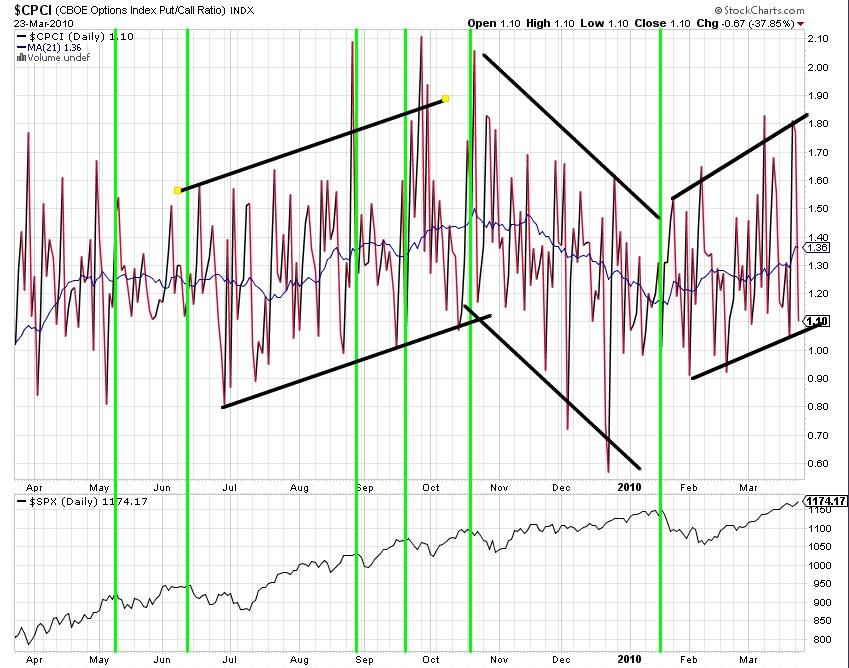
We can see three distinct trends in the data since July. During the July-October rally these professionals bought index puts to hedge their growing long positions as the rally proceeded. There was still much doubt about the durability of the advance and the smart money hedged. From mid-October to January we see increased complacency as these players decreased their hedging activity and showed some complacency with the rally. This may have been a factor in producing the January top. Since the January top we can see that index options players are once again hedging risk as the rally proceeds higher in the current wave 5, repeating the behavior seen in the wave 3 advance (and thus helping to confirm the validity of the wave structure).
The Total put/call ratio combines equity and index options.
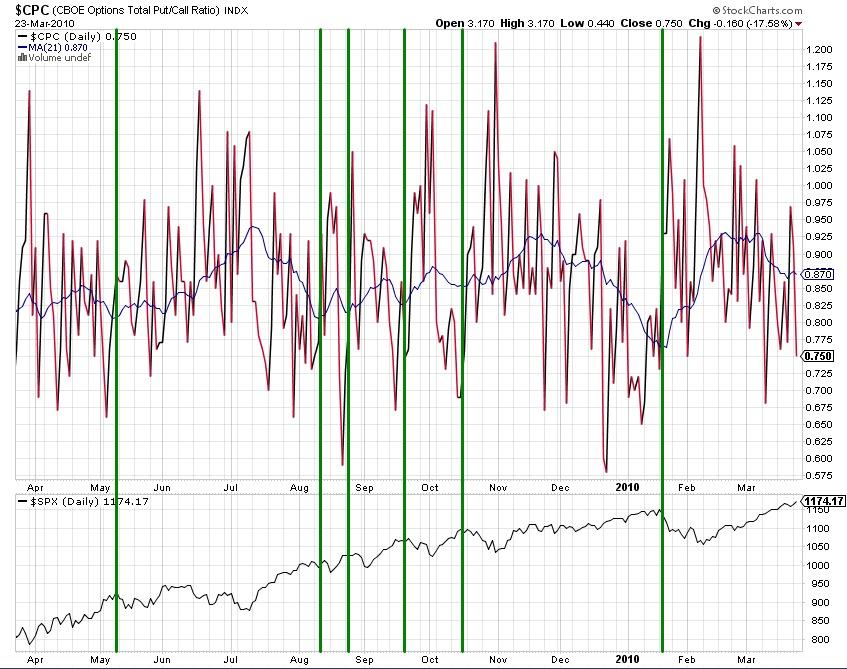
This chart has thusfar been more clearly predictive of tops and bottoms than the other two. We can see that it is far from levels seen at the August and January tops. My overall take is that while there may be enough bullishness in sentiment for a corrective wave 4 pullback to channel support at about 1150 on SPX, there is not yet the basis for calling a significant top. Certainly, there are breadth indicators not covered here which are showing significantly overbought readings. But in a strong bull trend, particularly one characterized by progressive bear capitulation ( vis Peter Schiff, Charles Biderman) and sideline money anxiety over "missing it", overbought can become more overbought for a while.
For the reasons cited above and many more not covered here, BullBear traders are looking for a mid-late April top in the 1228-1244 area with a minor wave 4 corrective decline to support after acheiving the reverse head and shoulders target of 1178-1180 (with a possible extension to whole number resistance at 1200).
For a more complete analysis including coverage of stock sectors, the precious metals, crude oil, forex and technical indicators watch the BullBear Weekend Report:
www.youtube.com/watch?v=U9Yvv5KbDMk
Generally these reports as well as twice weekly video reports are prepared for BullBear Trading Service members and then released to the general public on a time delayed basis. To get immediate access just become a member. It's easy and currently free of charge.
Good luck and good trading!
Steven Vincent
TheBullBear.com
"Keeping You on the Right Side of the Markets"
Disclosure: Long SPX
Replies to This Discussion
-
Permalink Reply by Mark Lytle on
-
Hello Steven,
I was perusing your article, and my eye was caught by this:
"On a very long term basis, an argument can now be made that SPX is now in Wave 1 of Wave 5 in the primary bull market that began after the better than 90% retracement that ended in 1932. In this schema the lateral bear market from 2000-2009 was a Wave 4 A-B-C corrective wave similar to the lateral corrective Wave 2 from 1966-1974. The bull market that ended in 1929 marked the end of the Industrial Revolution wave in financial assets. We are then currently beginning the terminus wave of the Financialist Fiat regime that began with the founding of the Federal Reserve system in 1913 and the subsequent adoption of Keynsian economics and socialist government. This wave may possibly be marked by a pure asset bubble without any fundamental underpinnings whatsoever and may be very large as well as short in time but followed by a resoultion similar to the post-1929 scenario. The dénouement of this epochal terminus would then resolve into the age of World Government and Global Economic Management. This is a working thesis and there are other interpretations of wave counts as well as socio-economic development."
That's interesting, I had no idea you were incorporating any of the social/economics stuff into your work. I now see why you're so bullish, if you think we are in a final wave 5 of a move that had it's start in the 1930's depression bottom. I can't see from your chart where your wave 2 is, I would guess it's probably 1974 or 1980, depending. I am familiar with the concepts you speak of...
That's a reasonable count, and I can see why you might think this will happen, as you are expecting a hyperinflationary blow-off here...Thus some kind of astronomical final top on the S&P. Put more simply, where others see a double top in 2000 and 2007, you are focusing on a double bottom consisting of the 10/2002 and 3/2009 bottoms, as the A and C waves of a flat that would represent a wave 4. That is original....
The timing of such a top would in fact be fairly quick and large, that's true, as you note:
"This wave may possibly be marked by a pure asset bubble without any fundamental underpinnings whatsoever and may be very large as well as short in time...."
I am considering how I could prove mathematically whether your thesis is true or not, and you must understand I'm not trying to fight with you. I am a researcher with along resume. I do, and have done a lot of original work for oil companies in the '70's and was an IT analyst through the '90's and I'm not afraid of mathematics...
The question then is, are the wave patterns to come connected to the past through something other than previous wave action, i.e. through either pure fiat control of markets and money supplies, or are they related deeply to the prior wave forms in time and price, going back to one or more of the previous Elliott waves? This makes all the difference...
This is what I'm asking your opinion on...it is currently possible to project trendlines from past price action, and as you can have fractals within fractals, I can scale that analysis accordingly...
If it's all fiat, it's much harder. I don't know if it's possible or impossible. I would have to think about it...
Anyway, this is what I'm curious about...
Regards,
Mark L.
-
Permalink Reply by Steven Vincent on
-
Thanks Mark. Can you please post my email reply to your reply? I don't have a copy of that text.
-
-
Yes, your response was:
"Hi Mark. Thanks for your response to my piece. Please post it as a reply to my posting of the piece in the main Discussion Forum so others can benefit from it as well and join in the exchange.
Actually not sure how to answer that...requires a lot of thought. I do think I am onto something. Yes, Wave 1 would be 1932-1966, Wave 2 1966-1974, Wave 3 1974-2000, Wave 4 2000-2009 and Wave 5 2009-????
I also do think that we could recount this and see the current wave from a much more bullish perspective as a Wave 3 with the flat of the last decade as a corrective wave 2. In that scenario the globalization of the economy together with the economic build out of the rest of the world's infrastructure and the productivity and efficiencies resulting from radical new technologies in computer sciences and biotech and energy results is a historically massive growth phase. An equally plausible view.
Unlike many I do not start with a philosophical construct and then search for data points to buttress my view. That is not analysis and not usually profitable in trading. My philosophical underpinnings are capitalist, anti-monetarist, anti-Keynesian, anti-collectivist, sound money and Libertarian. Unlike the vast majority of those who hold similar views, I recognize that Keynesian Socialist Monetarism has power and can produce results in the world. Do we like the QUALITY of that result? That is another matter...
-
Permalink Reply by maxwell seaman on
-
What about peak oil. All this analysis is great but the market is reactionary and the trends, waves, moves are formed in retrospect. Its easy to look back and say this is how it moves but really, that's not worth much. Realistically, this entire market is at the mercy of energy consumption. So what if we establish we're at peak and thus soon declining in the next 4 years? Hyper inflation of paper money first (who in their mind would trade paper for a oil at that point). But not even gold will buy oil once the full impact of oils output is recognized. We went from 1.5 to 6 billion people thanks largely to the efficiency and technologies produced by oil. Does technology beat that panic... Past trends would suggest the market, i.e., people, react and typically late. This time might be too late. Unless you believe there is plenty of oil setting off shore that.s supper easy to get to. But that costs $80 minimum, realistically $100 plus. The top hedge fund managers are buying farms... are they insane or just in early?
Of course I have friends who point out how recycled plastic bags can be used to make gas now. And that biomass can produce plastic. I still have to ask, why is oil so costly. Are the oil barrens running around killing all the new tech trends before they can happen? That would suggest that the entire monetary system has become threatening to the vast population. Of course I disagree that these wondrous technologies will step up in time to save the day, not that they can anyway because the net energy loss to produce them far out weights any positive gains.
I'd like to know your thoughts.
Cheers
-
-
I am running to an appointment soon so I have to be brief. Will try to add more later.
First, don't believe in peak oil. Think it's more wall of worry stuff.
Second, all asset prices are increasing (at least initially) on the basis of massive, mind boggling monetary inflation. That includes oil.
Third, peak oil has no direct bearing on other asset prices.
Will try to get into this more later.
Thanks for your thoughts. Welcome to TBB!
-
-
Thanks, I look forward to your explanation because I don't understand how you can argue peak oil has no direct bearing on other asset prices. Oil is needed for cheap transportation/shipping, fertilization, drilling, mining, industrial production, and agriculture (all machines used to harvest run on oil, all metals are produced or founded via oil, all crops are fertilized with petroleum based fertilizers, all pesticides are made from oil, etc.).
You seem to be skeptical of govt numbers like most smart traders but you trust their views on oil? The only group now saying peak oil will happen later than 2014 is SARA. All other industry experts now say we're at peak including Obama's adviser on the subject. Of course they use "undulating plateau" not "peak" as the choice language.
Read: http://petrole.blog.lemonde.fr/2010/03/25/washington-considers-a-de...
Now if the govt is saying its possible between 2011-15 and they are speeding up the requirements on cars, what does that signal? This is the same group [the govt] that didn't see an issue in the mortgage market until after it was too late.
And of course discoveries have been declining since 1964 which indicates a peak in production 40-50 years later... The stats don't lie. IF we can't up our production how does the economy grow? Easy cheap oil is declining.
So, if you have stats and data that points otherwise please details... because then I'll change my position to bullish. Fiat money is perfect if we got loads of oil. Infinite energy = infinite money.
Cheers
-
Permalink Reply by pennystocksville on
-
Very nice stock market analysis...
Join BullBear Traders
SUBSCRIBE Here
Pay with Cryptocurrency and SAVE!
(regularly $120.00)
Social Links
Steven Vincent's market analysis is published on:
© 2024 Created by Steven Vincent.
Powered by
![]()